Understanding the Messy Reality of Information

The Modeling Myth
We live in a world obsessed with data. We collect it, store it, analyze it, and build entire systems around it. But it's important to remember that the way we organize and represent this data (our data models) is never a completely accurate picture of the real world. They're more like simplified maps than perfect replicas. And understanding that difference is absolutely crucial for building anything that uses data (which is pretty much everything these days!).
Table of Contents
- The Modeling Myth
- The Map is not the Territory
- Why "Simple" Attributes Aren't So Simple
- Relationships - A Coordinated Team Effort
- Understanding Types and Instances
- Summary
- Your Feedback and Further Exploration
The Map is not the Territory
Think about a map of a city. It shows you the streets, maybe some landmarks, and perhaps the subway lines. Useful, right? But it doesn't show you the smell of the bakery on the corner, the sound of the busker playing guitar, the feeling of the sun on your face, or the conversation happening in the cafe. The map is a representation, a useful tool, but it's not the city itself.

As the saying goes, "The map is not the territory." This isn't just a interesting philosophical idea. It's a fundamental truth about all representations, including data models. They're artificial constructs, useful ways to deal with information, but they always involve simplification and abstraction. Just like a formal grammar doesn't perfectly capture how we actually speak, a data model never fully captures the messy, subjective, ever-changing reality it tries to represent. We're always making choices about what to include, what to leave out, and how to categorize things. And those choices are inherently subjective.
In the following sections, we'll dive deeper into specific aspects of data modeling - defining "things", dealing with ambiguous attributes, and understanding complex relationships, always keeping this "modeling myth" in mind. We're not trying to create a perfect mirror of reality. We're trying to create a useful map that helps us navigate it. By embracing the imperfection, we can build better, more insightful, and more useful information systems.
What Exactly Are We Talking About?
Data modeling seems straightforward, right? We identify the "things" (entities) we need to track and define their relationships. But figuring out what constitutes a single "thing" is surprisingly tricky.
The problem is that what looks like one "thing" in one situation might be several "things" in another. We humans are great at using context to understand what someone means. We usually don't even think about it! But when we try to combine data from different systems or perspectives. That's when these hidden assumptions cause major headaches. Suddenly, we have to be very specific about what our data represents in the real world.

Sounds straightforward, doesn't it? But consider these scenarios:
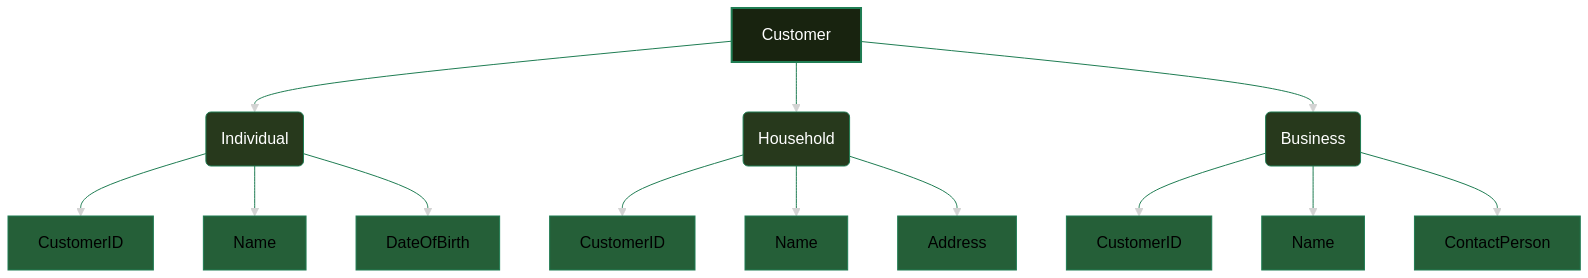
- Individual vs. Household: Is a "customer" a single person, or could it be a household that shares an account? A family of four might have one account with an online retailer, but are they one customer or four?
- Business vs. Individual: Does a "customer" always refer to an individual, or could it also be a business entity (a company, a non-profit)? A software company might sell to both individual users and large corporations.
- Potential vs. Current Customer: Is a "customer" someone who has already made a purchase, or does it also include someone who has shown interest but hasn't bought anything yet (a "lead" or "prospect")? Marketing and sales departments might have very different definitions.
There's no single, universally "correct" answer. What counts as "one customer" depends entirely on why the data is being collected and used. A marketing team might want to track potential customers, while the accounting department only cares about those who have actually made a purchase.
This ambiguity isn't limited to business concepts. Let's look at some other examples:
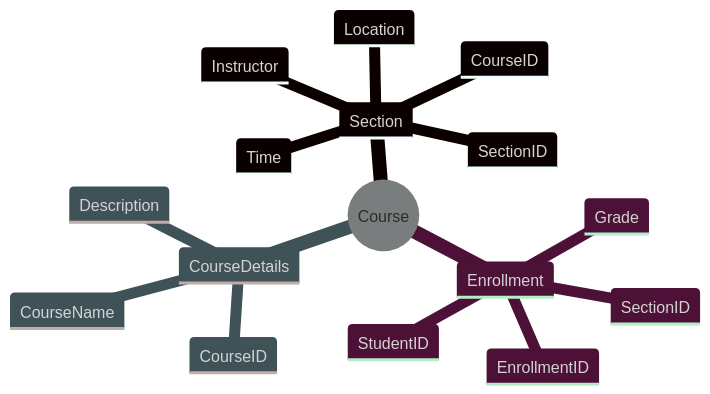
A "Course": In a university database, is a "course" the abstract offering (like "Introduction to Database Systems"), a specific section of that course (meeting at a particular time and place), or even an individual student's enrollment in that section? The registrar, the department, and the student might all have slightly different perspectives.
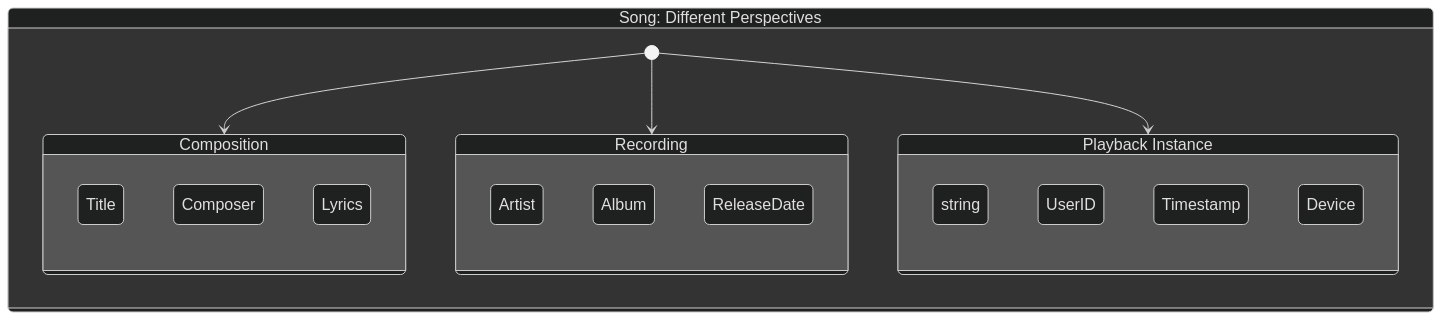
A "Song": In a music streaming service, is a "song" the original composition, a specific recording of that song by a particular artist, or even a user's instance of playing that song (a "play")? The rights management system, the recommendation engine, and the user's listening history would all treat "song" differently.
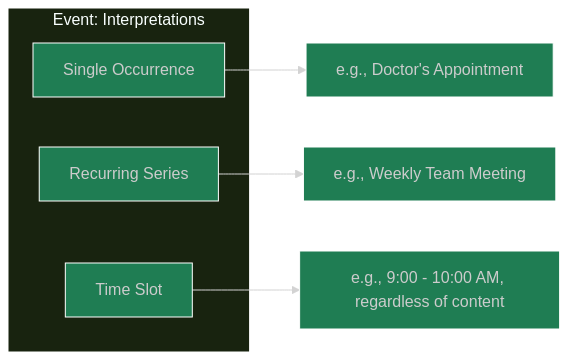
An "Event": In a calendar application, is an "event" a single occurrence, a recurring series (like a weekly meeting), or even just a time slot (regardless of whether something is scheduled)? A user might define "event" differently depending on whether they are scheduling a one-time appointment or a recurring class.
The bottom line is that even seemingly simple concepts can have multiple valid interpretations. Before you can build a data warehouse (or any information system), everyone involved needs to agree on what each "thing" represents for their specific purpose.
Why "Simple" Attributes Aren't So Simple
We tend to think of attributes as those easy little labels we stick on things: a shirt is "blue", a price is "19.99 €", a size is "medium." Seems pretty straightforward, doesn't it? But even the simplest attributes can be more complicated than they appear.
The problem boils down to this: the meaning of an attribute isn't fixed. It changes depending on who's asking and why they're asking. Remember how we talked about defining a single "thing"? Well, attributes are just as slippery. It's all about perspective and context.

Let's dive into the world of fashion and look at the attribute "color." Imagine you're scrolling through an online clothing store and spot an appealing "red" sweater. What information does that "red" label really give you?
- What Your Eyes See: Is it the color you'd perceive if you held that sweater in your hands under, say, typical indoor lighting? That's probably your first thought as a shopper. But, our eyes aren't perfect, and "typical" lighting isn't always the same.
- The Designer's Code: Behind the scenes, designers and manufacturers rely on precise color codes (like Pantone or Hex codes). To them, "red" might be a very specific Pantone value, ensuring consistency across the entire production process.
- The Marketing Magic: Marketing teams love to use descriptive, almost poetic, color names: "Crimson Sunset", "Cherry Blossom", "Ruby Fire". These names sell, but they're not standardized. Your "Ruby Fire" might be my "Scarlet Blaze".
- The Dye Itself: The actual chemical dye used to color the fabric is a whole other level of detail. This matters to textile engineers, manufacturers (think about colorfastness!), and eco-conscious consumers.
- Main vs. Accent Colors: Is the garment a solid "red", or does it have a red pattern on a white background? The proportion of colors matters, especially for search and filtering.
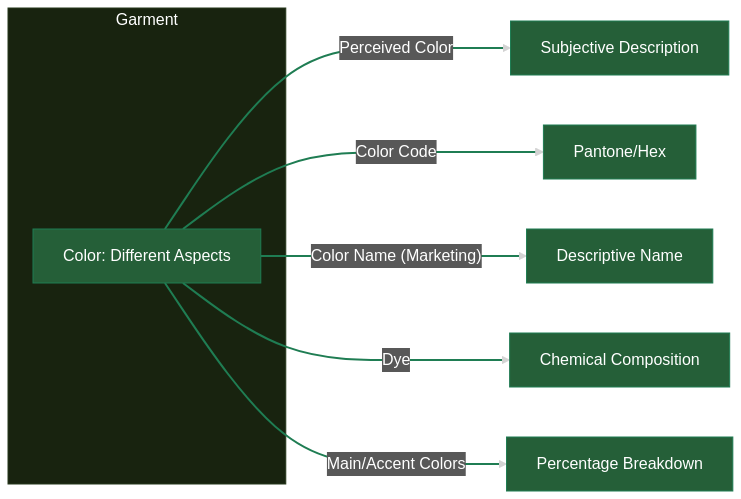
So, that simple word "red" is actually packed with potential meanings. The level of detail we need, and the specific situation, totally transform how we should define, understand, and use that attribute.
And this isn't some abstract, theoretical problem. It has real consequences! Imagine ordering that "red" sweater, expecting a bright, cheerful cherry red, only to receive something closer to a dark burgundy. Disappointment, returns, bad reviews... it all starts with that ambiguous attribute.
Relationships - A Coordinated Team Effort
We usually think of data relationships as simple connections: a customer buys a product, a website has pages. Seems straightforward, like a one-on-one conversation. But in many real-world situations, especially in something as complex as the German energy market, it's more like a group chat with multiple participants! It's not just "A links to B". These complex relationships are everywhere, and we need to understand them to build effective information systems.

Let's explore how this plays out in the German energy market from an energy trading company's perspective.
A Real-World Example
The Players on the Team
An energy trading company is supplying electricity to a factory. Here's a breakdown of the key players and how they work together:
- Renewable Producer: Imagine a solar farm in Bavaria, generating 10 MWh of clean energy.
- Energy Trader: The trading company buys that solar power from the producer and sells it to the factory, trying to get a good deal for both sides.
- Grid Operator: Think of them as the delivery service, responsible for transporting the electricity all the way from Bavaria to Saxony. They charge a fee for using their grid.
- Delivery Point: This is the specific substation where the electricity finally arrives at the factory's grid – like the factory's "power outlet".
- Balancing Group Manager: This is a separate company whose job is to keep everything balanced. They make sure the amount of energy going into the grid (like from the solar farm) matches the amount going out (like to the factory) within their specific "balancing group". The energy trader works hand-in-hand with them.
The Playbook and the Balancing Group Manager's Role
- The Schedule: The energy trader creates a detailed schedule. This is like a game plan, outlining the planned moves: buying 10 MWh from the solar farm and selling 10 MWh to the factory. The trader sends this schedule to the Balancing Group Manager before the electricity actually starts flowing (it's due the day before, by noon – Day-Ahead Market (D-1) before 12pm).
- The Balancing Group Manager's Balancing Act: The Balancing Group Manager uses the schedules from everyone in their balancing group to keep the overall energy flow in check.
- Imbalances and Balancing Energy: If the factory ends up using more electricity than planned (let's say 12 MWh instead of 10 MWh), that creates an imbalance. It's the Balancing Group Manager's job to fix this imbalance using something called balancing energy.

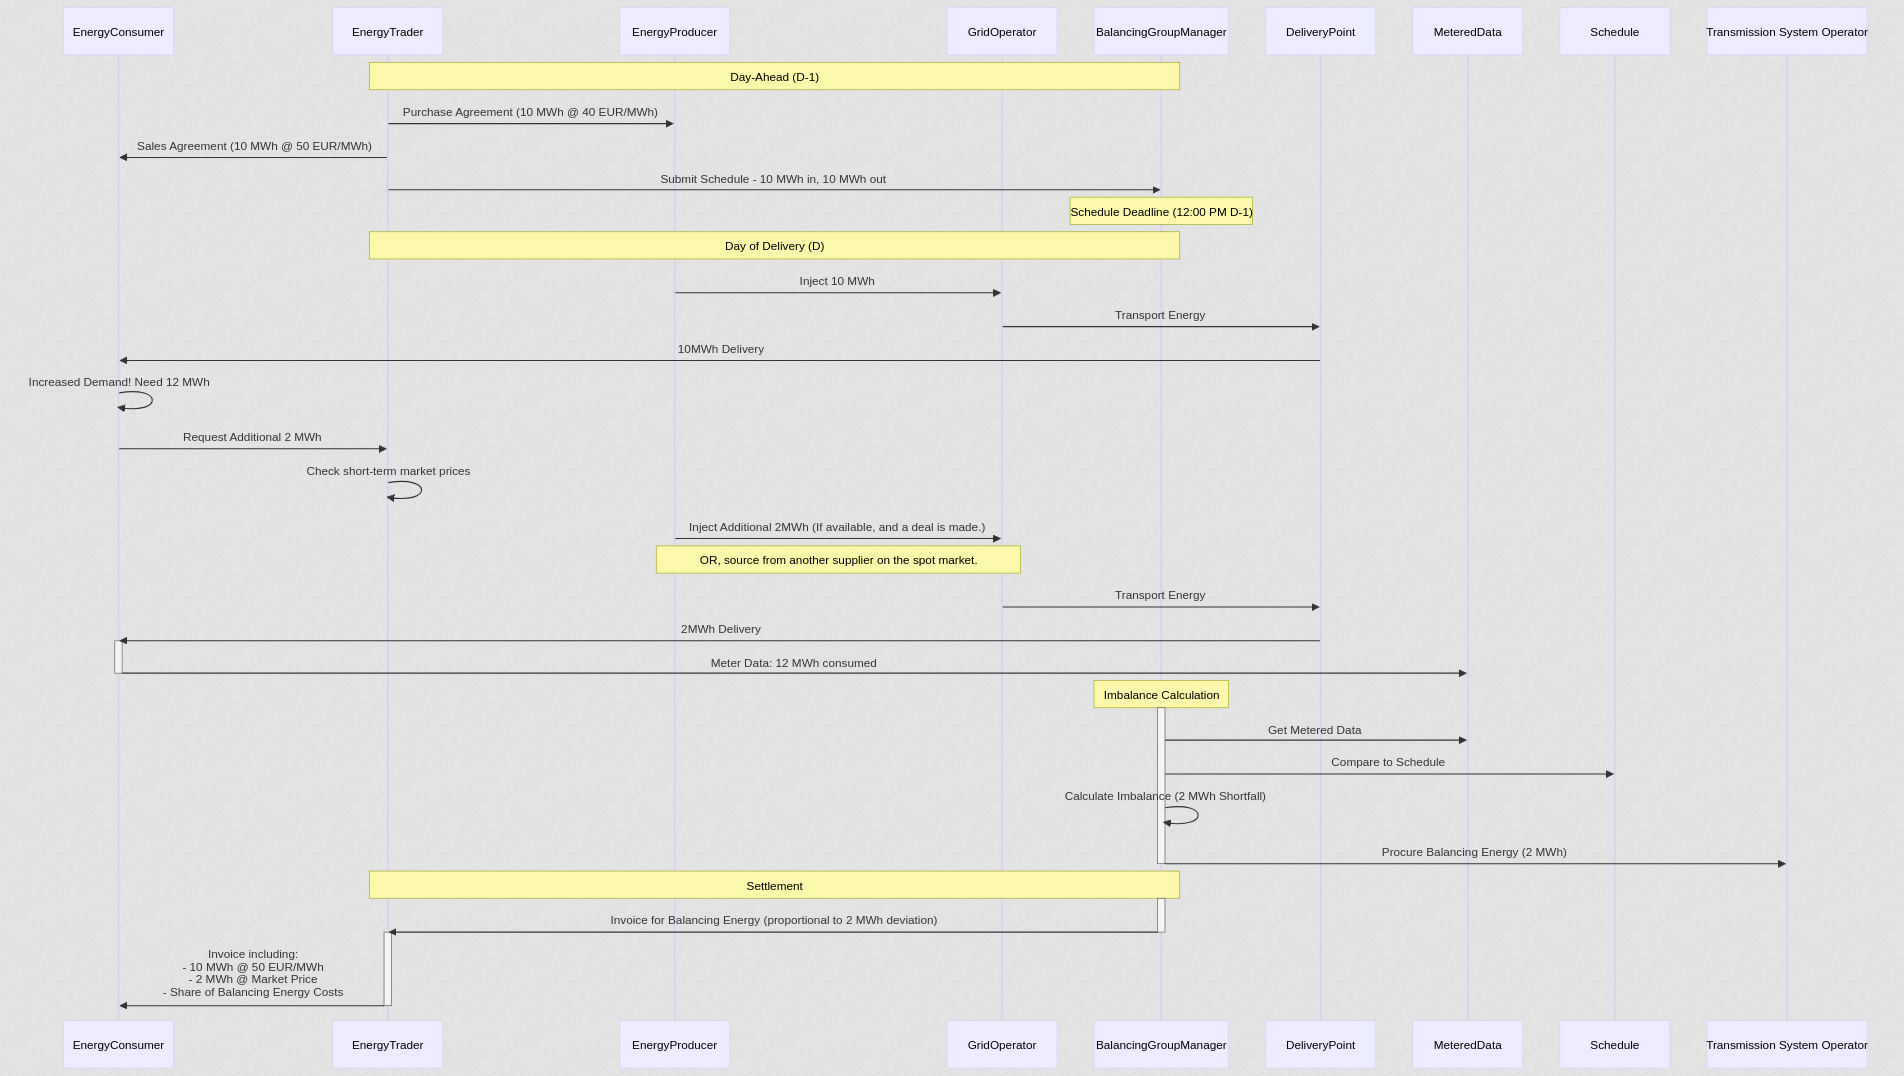
Breaking Down a Typical Deal
To illustrate how a typical energy trading deal works, let's outline the initial steps in our energy trading example. Imagine an energy trading company is facilitating the flow of electricity from a solar farm to a factory. The process begins with these key agreements and actions:
- Purchase Agreement (Producer to Trader): First, the energy trader agrees to buy electricity from the energy producer (solar farm). For example, they might agree to purchase 10 MWh of solar power at 40 EUR/MWh. This is a formal agreement establishing the terms of the energy purchase directly from the producer.
- Sales Agreement (Trader to Consumer): Next, the energy trader enters into a sales agreement with the energy consumer (factory). They agree to sell the electricity, in this case, the same 10 MWh, to the factory, perhaps at a price of 50 EUR/MWh. This agreement defines the terms of the energy sale to the factory.
- Schedule Submission (Trader to Balancing Group Manager): Based on these agreements, the energy trader creates and submits a detailed schedule to the Balancing Group Manager. This schedule outlines the planned energy flow – in our example, 10 MWh of energy expected to flow into the grid (from the solar farm) and 10 MWh to flow out (to the factory) within their balancing group for a specific delivery day. This schedule is crucial for the Balancing Group Manager to maintain grid stability. Crucially, this schedule must be submitted by a specific deadline, typically the day before delivery (Day-Ahead Market, D-1) before 12 pm.
- Demand Increase: Now, imagine that closer to the delivery time, or even during the delivery day, the factory's demand unexpectedly jumps. Instead of 10 MWh, they now need 12 MWh. The factory informs the energy trader of this increased need, requesting an additional 2 MWh.
- Trader's Response to Increased Demand: The energy trader has a few options to meet this new demand. They might:
- Source from the Spot Market: Buy the extra 2 MWh on the regular, short-term electricity market. Prices here can fluctuate.
- Utilize Own Resources: If the trader has access to other energy sources, they might use those to supply the additional 2 MWh.
- Let's assume the trader is able to supply the extra 2 MWh, potentially at a higher market price than the original 50 EUR/MWh.
- Imbalance and Balancing Energy: Because the factory is now consuming 12 MWh instead of the scheduled 10 MWh, a 2 MWh imbalance is created within the Balancing Group Manager's area of responsibility. The Balancing Group Manager must ensure the grid remains balanced. To do this, they might need to procure "balancing energy" – essentially, activating reserve power sources to compensate for the unexpected increase in demand.
- Cost Allocation and Responsibility: The costs associated with this balancing energy are not free. They are allocated proportionally to the parties responsible for the schedule deviation. In this case, even though the trader initially submitted an accurate schedule based on the original agreement, by supplying the additional 2 MWh without updating the schedule (which might be impossible due to real-time constraints and schedule submission deadlines), the trader has knowingly caused the actual energy flow to deviate from the submitted schedule. Therefore, the energy trader will bear a portion of the balancing energy costs.
- Financial Implications for the Trader: The trader faces a complex situation:Increased Revenue: They can sell the extra 2 MWh to the factory, potentially at a higher price than the initially agreed 50 EUR/MWh, increasing their revenue.Balancing Energy Costs: They will incur balancing energy costs due to the imbalance they contributed to.Market Risk: Short-term energy market prices and balancing energy costs are volatile. The trader needs to carefully calculate if the increased revenue from selling the extra 2 MWh will outweigh the balancing energy costs and other risks.
- Contractual Risk Mitigation: To manage this risk, it's crucial for energy traders to have well-defined contracts with their customers (like the factory). These contracts should include clauses that allow the trader to pass on a share of these imbalance costs to the customer, reflecting the customer's contribution to the imbalance through their changed demand.
After these initial agreements and the schedule submission, the physical delivery of electricity occurs on the Day of Delivery (D). The Balancing Group Manager then monitors the actual energy flows and manages any imbalances that may arise.
Managing Risk - The Financial Playbook
Besides just buying and selling electricity, energy traders also use financial tools to protect themselves from price swings and unexpected events. These tools don't involve moving actual electricity, but they're linked to energy price indexes. Think of them as "insurance policies":
- Futures Contracts: Energy traders can use futures contracts to agree to buy or sell electricity at a set price on a future date. This helps lock in a price, protecting from prices going up or down in undesirable ways.
- Options Contracts: Options give the right, but not the obligation, to buy or sell electricity at a certain price by a specific date. It's like having a backup plan. A trader might buy "call options" to protect against rising prices, but if prices drop, they don't have to use the option – they can just let it expire.
- Swaps: Swaps are a bit more complex, but basically, they involve exchanging payments based on different price indexes. For example, a trader might agree to pay a fixed price for electricity while receiving a floating price based on a market index. This can help smooth out costs if the market price jumps around a lot.
Traders usually trade these financial instruments on places like the European Energy Exchange (EEX) – think of it as a stock market for energy.
Visualizing the data model
To bring these "things" to life, let's visualize the data model after considering all relevant factors discussed so far. What you see below is a simplified sketch, a kind of starter model for our energy trading example. Think of it as a learning tool, not a blueprint for a real-world system. Don't expect to use this directly for a live, complex energy trading platform! Instead, this example is designed to shine a spotlight on the essential things you must think about when you're diving into data modeling, especially in intricate areas like energy trading.
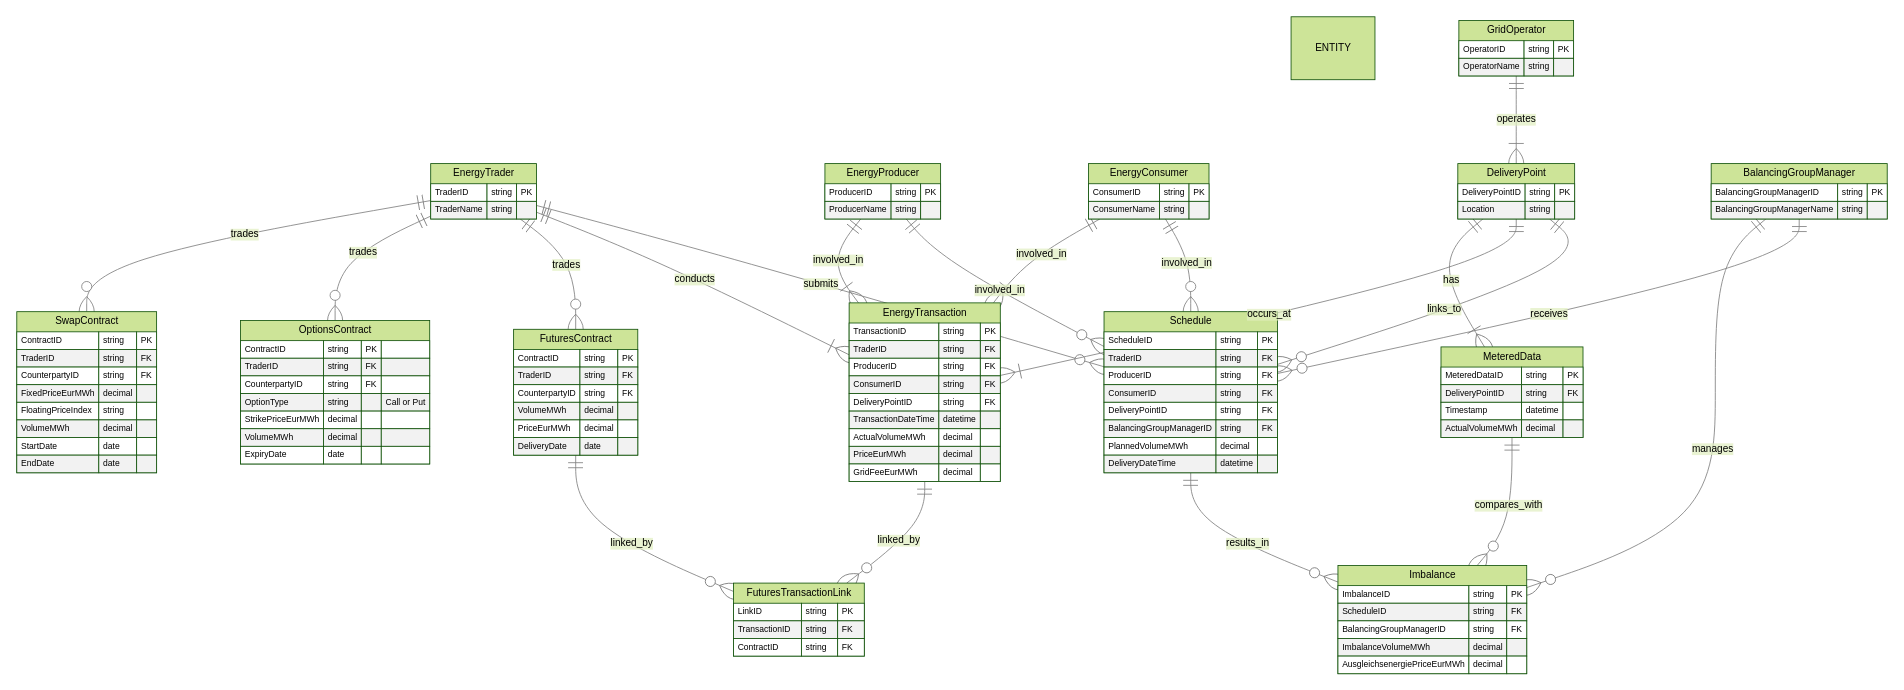
In reality, building data models for these kinds of complex businesses means carefully considering these key aspects, which we'll explore next:
- 1. Start with "Why?": Think of data modeling like building a house. You wouldn't start without knowing what the house is for, right? Same with data! Always begin by asking: "What business questions are we trying to answer with this data?" Don't just collect data for data's sake. Focus like a laser on the business value. Will capturing this information truly help us make smarter decisions, improve processes, or solve real problems? Prioritizing business needs keeps your model grounded and prevents it from becoming a complex, unusable mess. It's all about being practical and purposeful.
- 2. Stakeholders as Your Compass: Imagine you're planning a trip. You need to know who's going, where you're going, and what you want to do. Data modeling is similar – you need your stakeholders to be your compass! Collaborate closely with the people who actually use the data - your business stakeholders. They're the experts on the critical processes, the reports they need (including those pesky regulatory reports!) and the analyses that drive their decisions. Let them guide you on what to include and, just as importantly, what to leave out. Remember, our example diagram is simplified. Real-world energy trading? The scope is way bigger, so stakeholder guidance is essential to keep it manageable and valuable.
- 3. Source System Limits: We can dream big, but we also need to be realistic. Think of your source systems - like Energy Trading and Risk Management (ETRM) systems - as the building blocks you have available. These systems have limitations. They might not capture all the data you envision, or they might structure it in ways that aren't ideal. Design your data model with these practical constraints in mind. Work with what you actually have access to. For example, maybe your ETRM system is great with electricity trades but less flexible with complex derivatives. Knowing these limits upfront will save you headaches later.
- 4. The Hybrid Approach: Data modeling isn't a straight line. It's more like a winding road! Embrace iteration. Think of it as a journey of refinement. A smart way to navigate this journey is with a hybrid approach. This means balancing two things:
- Capturing the Real World: You want your model to be a useful representation of a complex domain like energy trading. So, you need to capture enough detail and complexity to make it accurate and relevant.
- Being Practical and Flexible: But you also need to be practical! Start with a manageable scope, get feedback, and then gradually expand and refine your model. Don't try to boil the ocean in one go. Iteration is your friend.
- 5. Maintain Clarity: Iteration is great, but be careful not to get too granular too soon. Imagine zooming in on a map so much you can only see individual streets and lose sight of the city. Excessive focus on tiny details (like very specific 1-to-1 relationships) early on can actually make your model less understandable. You can lose the big picture! Strive for a sweet spot: enough detail to be useful, but still clear, manageable, and easy for everyone to grasp. Clarity and maintainability are just as important as detail.
Understanding Types and Instances
Now, let's tackle a fundamental idea that, if misunderstood, can lead to some serious problems in your data: the difference between types and instances. It might seem obvious, but many data disasters stem from mixing these two up.
A Library of Confusion
Imagine a library. You have many different kinds of books (novels, biographies, textbooks) and you have many individual copies of each book. Confusing the kind of book with a specific copy would lead to chaos! You wouldn't know how many copies of "The Three-Body Problem" you have, or whether a particular copy is checked out or on the shelf.
In data modeling, mixing up types and instances is like that disorganized library.
It leads to:
- Inconsistent Data: You might try to say that all copies of "The Three-Body Problem" are checked out, which is likely untrue.
- Messed-Up Relationships: You might connect a borrower to the general idea of "The Three-Body Problem" rather than to a specific copy.
- Query Nightmares: Trying to find out how many copies of a book are currently available becomes impossible.

Book Titles and Physical Books
So, what's the crucial difference?
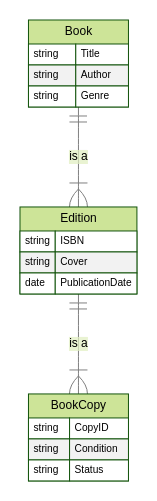
- A type (or class) can represent different levels of abstraction. We can have a "Book" type, and then more specific types like "Edition." "The Three-Body Problem" by Liu Cixin is a type representing the work itself. "Edition" is a subtype of "Book", representing a specific published version identified by its unique ISBN.
- An instance (or object) is a specific, physical copy of that book. It's one particular book sitting on the shelf (or checked out, or in someone's backpack). It has its own unique ID (maybe a barcode), condition (new, used, dog-eared), and location (which shelf, checked out to whom, lost in the mail). Each copy of "The Three-Body Problem" is an instance of the "The Three-Body Problem" type.
A single real-world thing can also be an instance of multiple types. A copy of "The Three-Body Problem" could be an instance of "Book", "Science Fiction Novel", "Hardcover Book", and "Loanable Item.”

Example: "The Three-Body Problem"
"The Three-Body Problem" by Liu Cixin is a type (the book title). But we also have different editions, each with its own ISBN:
- Type: Book - The Three-Body Problem
- Title: The Three-Body Problem
- Author: Liu Cixin
- Genre: Science Fiction
- Subtype: Edition - First Edition Paperback
- ISBN: 978-0765382030
- Cover: Paperback
- Publication Date: 2016-01-12
- (Inherits Title, Author, Genre from Book)
- Subtype: Edition - First Edition Hardcover
- ISBN: 978-1035909575
- Cover: Hardcover
- Publication Date: 2024-09-12
- (Inherits Title, Author, Genre from Book)
- Subtype: Edition - Second Edition Paperback
- ISBN: 978-076538203X <- Hypothetical new ISBN
- Cover: Paperback
- Publication Date: 2025-03-08 (example date)
- (Inherits Title, Author, Genre from Book)
Now, instances (specific copies):
- Instance 1:
- Copy ID: 9780765382030-001
- Condition: New
- Status: Available
- Edition: First Edition Paperback (links to the correct Edition type)
- All the attributes from the specific Edition and Book
- Instance 2:
- Copy ID: 9781035909575-001
- Condition: Used - Good
- Status: Checked Out
- Edition: First Edition Hardcover (links to the correct Edition type)
- All the attributes from the specific Edition and Book
- Instance 3:
- Copy ID: 978076538203X-001
- Condition: New
- Status: Available
- Edition: Second Edition Paperback
- All the attributes from the specific Edition and Book
The CopyID is unique to each physical copy. The ISBN is unique to each edition. We now have three "Edition" subtypes: First Edition Paperback, First Edition Hardcover, and a hypothetical Second Edition Paperback (with a made-up ISBN ending in "X" to illustrate the point).
In the world of data, always ask: "Am I talking about the general concept of the book, a specific edition (identified by its ISBN), or a particular physical copy?" Mastering this distinction is fundamental to building effective and reliable information systems.

Summary
We've journeyed through the sometimes murky waters of data modeling, and hopefully, one key idea has become crystal clear: data is never a perfect reflection of reality. It's always a map, a simplified representation, shaped by our choices, our perspectives, and the limitations of our tools.
This isn't a cause for despair. It's a call for mindful design. We've seen how even seemingly simple concepts like "customer" or "color" can explode into a multitude of meanings depending on who's asking and why.
We've explored the complex inter-dependencies and relationships within systems, like the energy market, where a single transaction involves a whole cast of characters, each with their own role and perspective.
And we’ve dived into types and instances, and why mixing them can cause damage.
The path to effective data modeling, then, isn't about striving for an impossible, mirror-like perfection. It's about embracing these principles:
- Start with Why: Always anchor your model in concrete business needs. What questions are you trying to answer? What decisions will this data inform?
- Stakeholder Collaboration: Don't work in a vacuum! Your stakeholders are your compass, guiding you towards what truly matters and, crucially, what can be safely left out.
- Pragmatic and Iteartive: Stay flexible, be mindful of your system, and be prepared to iterate.
By understanding the inherent ambiguity of information, acknowledging the limits of our models, and embracing a collaborative, iterative approach, we can build information systems that are not just accurate, but truly useful.
We can create a valuable map.
Your Feedback and Further Exploration
I hope this exploration of data's "messy reality" has been helpful!
Your feedback is invaluable - please share your thoughts, questions, or experiences in the comments below. I'd also love it if you shared this article with anyone who might find it useful!
Thank you for reading! ❤️